
Showing posts with label VREB. Show all posts
Showing posts with label VREB. Show all posts
Wednesday, April 1, 2009
March Sales Numbers
The VREB has released the March real estate sales numbers for Victoria. I got dizzy reading their report because of all of the spin!
Saturday, January 3, 2009
Happy New Year! 3 days late...
Happy New Year everyone. God bless, and we'll see what 2009 brings, right? I love roller coasters.
VREB has released the numbers for December. Slow sales, ever so small price increase in SFH and condos. The new VREB prez, Chris Markham, put the usual spin on the numbers. It may be just me, be he doesn't appear to be the eternal optimist that Tony Joe was.


VREB has released the numbers for December. Slow sales, ever so small price increase in SFH and condos. The new VREB prez, Chris Markham, put the usual spin on the numbers. It may be just me, be he doesn't appear to be the eternal optimist that Tony Joe was.


Saturday, November 8, 2008
October Sales Numbers
I'm a little late with the sales numbers this month. It's been a busy week...
How the VREB can put a positive spin on this past months numbers is beyond me. Sales were abysmal! The VREB will positive spin anything - if there was 1 sale, with a selling price of one million bucks, the headlines would read "Prices hit a new record, sales soften". Go figure.
Here's the usual graphs...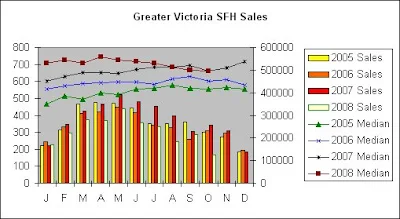


Wednesday, October 1, 2008
September Sales Numbers

That's the last time the average selling price of a single family home in Victoria sold for less than it did this September.
VREB has posted the sales numbers for September. They can be viewed on their website.


Tuesday, September 2, 2008
August Sales Numbers
VREB has released the sales numbers for August 2008.
Comments have already started on this site. H/T to HHV and Roger as they have beat me to the punch.
However, here are my usual graphs.


Check out the months of inventory graph. We are so totally into a buyers' market!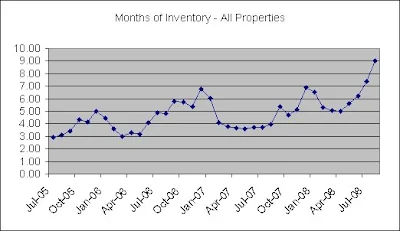
More to follow in the coming days!
Comments have already started on this site. H/T to HHV and Roger as they have beat me to the punch.
However, here are my usual graphs.


Check out the months of inventory graph. We are so totally into a buyers' market!

More to follow in the coming days!
Saturday, August 2, 2008
July Sales Numbers
2008 will certainly mark the beginning of the bear run. In July, sales continued to decrease, inventory remained high, and prices have rounded the corner and are dropping. The VREB stats can be found at their website.
Median sale price of SFH dropped for the 4th consecutive month and is 2.9% higher than July 2007.
Median condo sale price is the lowest since August 2007. Sales are 31% lower than July 2007. If this does not have the condo developers getting worried, then I have no idea what will.
Townhome sales are an anomaly. Median sale price was the second highest on record, however, sales are down 50% from July 2007.
Months of inventory of all properties jumped over the 7 month mark. This is the highest of all data I have access to (dating back to 2005).
Median sale price of SFH dropped for the 4th consecutive month and is 2.9% higher than July 2007.

Median condo sale price is the lowest since August 2007. Sales are 31% lower than July 2007. If this does not have the condo developers getting worried, then I have no idea what will.

Townhome sales are an anomaly. Median sale price was the second highest on record, however, sales are down 50% from July 2007.

Months of inventory of all properties jumped over the 7 month mark. This is the highest of all data I have access to (dating back to 2005).

Tuesday, June 3, 2008


Thursday, May 1, 2008
April Sales Numbers
I see that discussion has already started on April's sales numbers, as published by the VREB. Listings are up, sales numbers are down. I think that the average sales price for this past month is a moot point. As long as inventory rises and quantity of sales decreases, we move into, if we aren't already there, a buyer's market. Prices then start to decrease. Sellers are still holding out at this point because they see their neighbour sell their house for near asking price, yet they don't see the five other neighbours that aren't selling their homes.
What I don't understand is this - I see sales prices via a realtor's PCS. Why are people buying homes for the asking price? If you are in the market for buying - start lowballing!!!
I'm also quite surprised at the number of $1+ million sales. I thought that the smart money was those who had money. Obviously not.
Anyways, here are my charts. More to follow.


Tuesday, April 1, 2008
March Sales Numbers
The Victoria Real Estate Board has posted March's sales numbers. Commentary on the numbers started in the last post. Please do continue. It looks to me like this year is going to the bears.
Following are SFH, condo, and townhome graphs for Greater Victoria. More are to follow in the coming days.


Following are SFH, condo, and townhome graphs for Greater Victoria. More are to follow in the coming days.


Monday, March 3, 2008
February Sales Numbers
The Victoria Real Estate Board has released their sales numbers for February. Discussion has started in the comments of the previous post. Please feel free to continue commenting on this post.
In comparison to February 2007, sales are down, prices are up, and listings are up. In comparison to January 2008, sales are up, prices are down, listings are up. The last time that Greater Victoria has seen two consecutive months of single family home price decreases was between June and August 2006. SFH average price has decreased 6% since it's peak in December 2007.
Average condo price has pretty much been horizontal since November 2006.
Average townhome price is off big-time from it's peak in November 2007.
I'd love to provide some graphs, but unfortunately, about 2 weeks ago I had a horrendous case of spyware on my computer and was forced to format my hard drive. I haven't located my copy of Excel as of yet. Once I do, the graphs will be back!
Sunday, January 6, 2008
December Sales Numbers
I'm a little late on this one. I'm glad it's getting discussed in the previous posts' comments. Thus, I won't comment much here on the December numbers. However, I will throw out the graphs.
Single family home sales for the past three years. Look at the regional sales prices on the VREB website. Those million dollar SFH sales had to have only been in Oak Bay, Saanich East, and Victoria (maybe one in North Saanich). The other regions, they are either below or only marginally above the 6 month average.
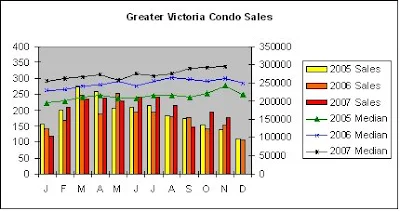
Condo sales.
Townhome sales.
Finally, months of inventory for all properties. Where is it going to go from here?
The football game has finally ended. Thank goodness! The Bulls kicker made a field goal. A Bears player made a late hit on the kicker, and a side clearing brawl ensued. Those Bears are sore losers! I'm just kidding. I'm just a bitter renter. Final score, Bulls 32, Bears 19.
Single family home sales for the past three years. Look at the regional sales prices on the VREB website. Those million dollar SFH sales had to have only been in Oak Bay, Saanich East, and Victoria (maybe one in North Saanich). The other regions, they are either below or only marginally above the 6 month average.

Condo sales.

Townhome sales.

Finally, months of inventory for all properties. Where is it going to go from here?

The football game has finally ended. Thank goodness! The Bulls kicker made a field goal. A Bears player made a late hit on the kicker, and a side clearing brawl ensued. Those Bears are sore losers! I'm just kidding. I'm just a bitter renter. Final score, Bulls 32, Bears 19.
Monday, December 3, 2007
November Sales Numbers
VREB has posted November's sales numbers. I was close on my estimates! Except for the average townhome price, the numbers don't surprise me. Bev McIvor's two bits have changed from "it’s important to note that nearly a third of single family homes last month sold for under $425,000" this last summer to "The high demand and robust prices show continued strong consumer confidence in the market" this fall. Also, I got a flyer in the mail today from "Condo Conroy" stating "There are FAR fewer units on the market right now than there was last year..." I call bullsh**.
It appears that stuff is still selling. The number that speaks the most to me is 623 sales. That is 9% more than last November, and more than November 2005. The market does still have legs. I'm beginning to think it will take something big to knock those legs out from under it.

It was a bullish month. The Bulls scored a field goal. Score is Bulls 29, Bears 19.
It appears that stuff is still selling. The number that speaks the most to me is 623 sales. That is 9% more than last November, and more than November 2005. The market does still have legs. I'm beginning to think it will take something big to knock those legs out from under it.


It was a bullish month. The Bulls scored a field goal. Score is Bulls 29, Bears 19.
Saturday, December 1, 2007
CMHC "Housing Now" Report for October
CMHC has released their October "Housing Now" report for Victoria.

Sunday, November 25, 2007
There's always next year...
It's tough watching your team lose the big game. But hey, they were big-time underdogs, and did better than I expected. Thanks Bombers, for the run this year, and better luck next year!
Back to real estate. Tell me, if the market is so hot, as according to the VREB, are there ads in the TC like the following for developments that are complete or nearly complete. Shouldn't they be sold out?!?


Back to real estate. Tell me, if the market is so hot, as according to the VREB, are there ads in the TC like the following for developments that are complete or nearly complete. Shouldn't they be sold out?!?


Thursday, November 1, 2007
October Sales Numbers
VREB has released the October sales numbers. H/T to Roger for beating me to the punch for commentary and review. You can read it over at HHV.
Single family home sales and median prices over the past 3 years in Greater Victoria.
Condo sales and median sales prices.
Townhome sales and median sales prices.
Draw your own conclusions. I think it's started. Looks like a bearish month. I'm awarding a touchdown to the Bears. And wait! What's that? HHV's attempting a two point convert! The pass is up, ball's in the air... and... knocked down by the defender! Sorry HHV. I just couldn't do it. The score is now Bulls 26, Bears 19.
Single family home sales and median prices over the past 3 years in Greater Victoria.

Condo sales and median sales prices.

Townhome sales and median sales prices.

Draw your own conclusions. I think it's started. Looks like a bearish month. I'm awarding a touchdown to the Bears. And wait! What's that? HHV's attempting a two point convert! The pass is up, ball's in the air... and... knocked down by the defender! Sorry HHV. I just couldn't do it. The score is now Bulls 26, Bears 19.
Monday, October 1, 2007
September Sales Numbers
I've now officially been forever priced out of the market!
Just kidding - that happened a long time ago!
Well, September numbers are out. My guesses were close. Total sales = 632. Total inventory = 3381 listings. Average prices up month over month in every category. Average prices up year over year everywhere. It's very reassuring that "There were 17 single family home sales of over $1 million and this had a significant impact on the overall average. Nearly a quarter of all single family homes sold for less than $425,000." Thank goodness for that!
Due to a shortness of time this evening, I'm gonna let the graphs do the talking.
Condo sales graph.
Townhome sales graph.
Single Family home sales graph.
Months of inventory graph.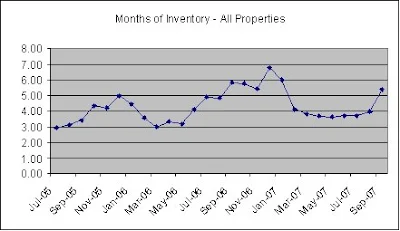
Oh yeah, 3 points for the Bears. It's the end of the 3rd quarter. Bulls 26 Bears 13.
Just kidding - that happened a long time ago!
Well, September numbers are out. My guesses were close. Total sales = 632. Total inventory = 3381 listings. Average prices up month over month in every category. Average prices up year over year everywhere. It's very reassuring that "There were 17 single family home sales of over $1 million and this had a significant impact on the overall average. Nearly a quarter of all single family homes sold for less than $425,000." Thank goodness for that!
Due to a shortness of time this evening, I'm gonna let the graphs do the talking.
Condo sales graph.

Townhome sales graph.

Single Family home sales graph.

Months of inventory graph.

Oh yeah, 3 points for the Bears. It's the end of the 3rd quarter. Bulls 26 Bears 13.
Tuesday, September 4, 2007
August Sales Numbers
HHV and Roger beat me to the punch for commentary on the VREB's release of the August sales numbers. Check out their blogs for some great insight.
All that's left is for me to bore you with some graphs, and an update to the football score.
Median single family home prices. Ouch, how the median in Victoria is dropping. The rest of the Capital Region District is really having to take up the slack.
Looking at sales of SFH in the past two years, the number of sales is higher this year. Median price appreciation continues at double digit or high single digit gains.
Condo sales numbers continue to be strong. However, the median price appreciation has been marginal the past couple of months.
This summer has been hot for sales of townhomes in Greater Victoria. The median sales price has been flat the past four months.
And finally, the Bears have scored a touchdown this month. The average sales price for condos and townhomes were lower than the six month rolling average. Without the sale of the $5million+ home in Oak Bay, average price of SFH would also have been lower than the six month average. Score: Bulls 26 Bears 10.
All that's left is for me to bore you with some graphs, and an update to the football score.
Median single family home prices. Ouch, how the median in Victoria is dropping. The rest of the Capital Region District is really having to take up the slack.

Looking at sales of SFH in the past two years, the number of sales is higher this year. Median price appreciation continues at double digit or high single digit gains.

Condo sales numbers continue to be strong. However, the median price appreciation has been marginal the past couple of months.

This summer has been hot for sales of townhomes in Greater Victoria. The median sales price has been flat the past four months.

And finally, the Bears have scored a touchdown this month. The average sales price for condos and townhomes were lower than the six month rolling average. Without the sale of the $5million+ home in Oak Bay, average price of SFH would also have been lower than the six month average. Score: Bulls 26 Bears 10.
Wednesday, August 1, 2007
July Sales Numbers
The VREB's sales numbers for Victoria for July show that the local real estate market continues to be both resilient and oblivious to what is happening south of the border. The numbers of sales this July blew away previous July numbers. It was the highest number of sales for July in 15 years. Greater Victoria saw higher average and median prices for SFH. Condo prices dropped, townhome prices were a mixed bag.
Year over year, the median price of a SFH in Greater Victoria is up 17.4% Last July's median was $438500. This July, $515000.
The number of SFH sales in Saanich continues to amaze me. This July, 150 sales. July 2005 and July 2006 had 113 and 110 sales, respectively.
Condo sales for Greater Victoria appear to have plateaued. Quantity of sales is consistent, prices are rising ever so slowly. This has to concern the developers who have hundreds of units available for sale.
The number of townhomes sold this July in Greater Victoria was the highest monthly amount for the years of which I have data (2005 - 2007). Year over year median prices are up 8.5%. Again, Saanich sold townhomes like they are going out of style. 47 this July. 23 and 17 the previous two Julys.
With the number of active real estate listings having decreased in July, prices should remain steady for the coming couple months. Inventory, according to VREB, is up only marginally from last year. Taking this into consideration, I'd say, don't expect to get any deals on SFH priced less than $500000.
I'd have to disagree with HHV, this was a month for the bulls. Listings down, sales up, prices up. I'm giving the Bulls a field goal. Score: Bulls 26, Bears 3.
In Canada, specifically Victoria, it's still tough being a bear.

Subscribe to:
Posts (Atom)
